RelationshipSample
Bubble chart
A scatter plot where circle area encodes a third measure.
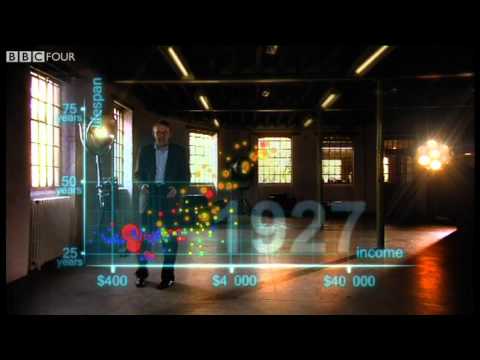
Income against life expectancy, sized by population.
Sample data
Use it when
- Relating two measures while showing the weight of each item
- A few dozen items at most
Avoid it when
- Readers must compare sizes precisely: area is hard to judge
Display modes
- Default
- Income against life expectancy, sized by population.
- Comparative
- Colours bubbles by region so regional clusters separate.
- Annotated
- Calls out the countries that sit far from the curve.
Seen in the wild
More in Relationship
Scatter plot
Plots two numeric measures against each other to reveal correlation, clusters and outliers.
Connected scatter plot
Plots two measures against each other and joins the points in time order, so the path tells a story.
Hexbin plot
Bins many points into hexagons and colours each by count, so density stays readable where dots would pile up.